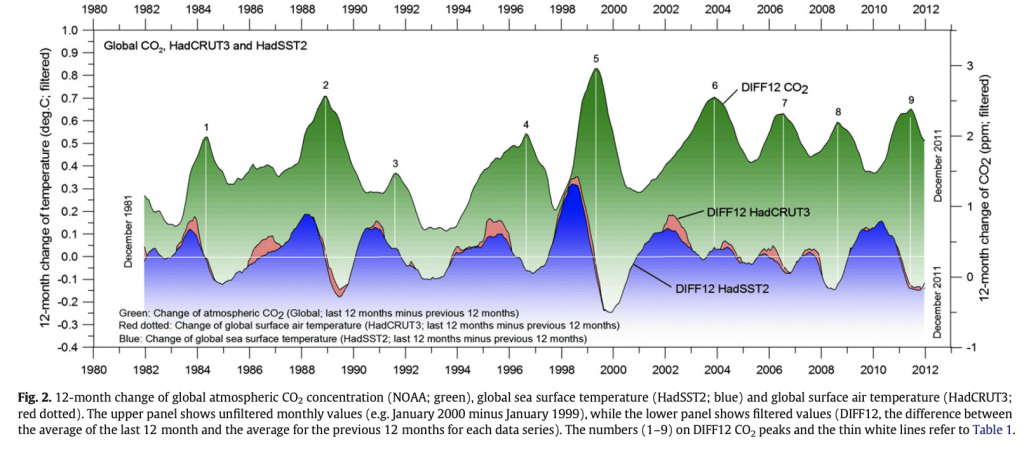
Thoughts Posted on May 1, 2022May 1, 2022 by fiori A key figure illustrating how changes/increases in the CO2 concentration follow after changes in the temperature. Posted in Climate Science.