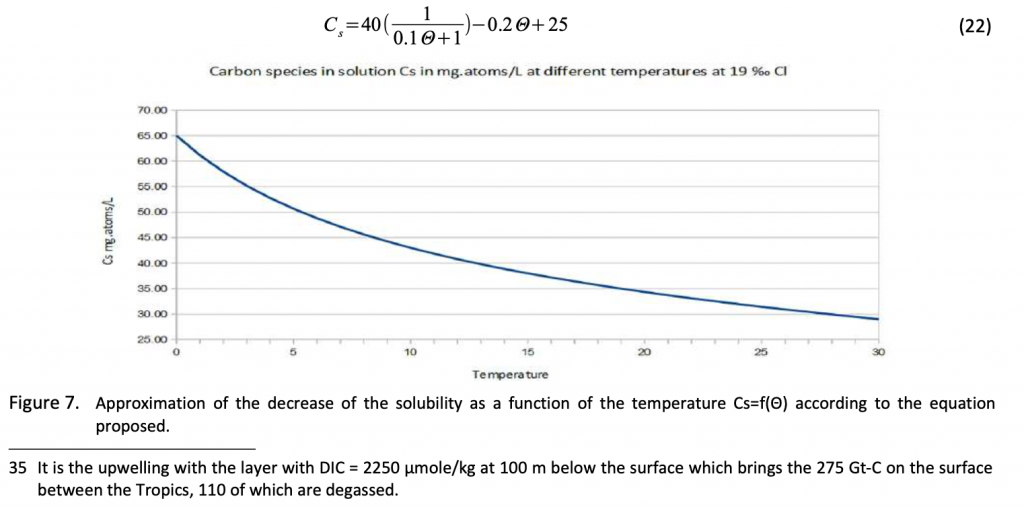
Above figure, explains why the CO2 concentration increases (in the atmosphere) when the temperature of the oceans increases (Dalton’s law).
Key papers on Climate Science
Above figure, explains why the CO2 concentration increases (in the atmosphere) when the temperature of the oceans increases (Dalton’s law).
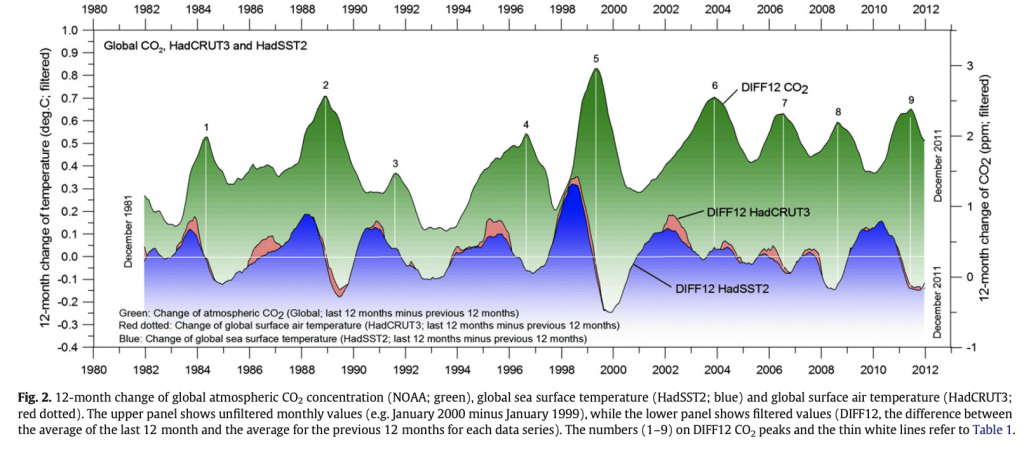
A key figure illustrating how changes/increases in the CO2 concentration follow after changes in the temperature.